
Navigating the Data Science Landscape: A 2024 Guide to Mastering the Field
Data science is booming. With 11.5 million new jobs expected by 2026, it's a field that's not just growing—it's exploding [Simplilearn]. When I first dipped my toes into this ocean of data, it was overwhelming. But once you get your bearings, it's an incredibly exciting journey. So, let's dive in and explore the vast world of data science together.
Learn about the latest trends in AI, SaaS, and software development

Table of Contents
- Introduction to Data Science
- Core Components of Data Science
- Advanced Data Science Techniques
- Data Science Tools and Technologies
- Data Science Ethics and Responsible AI
- Learnings Recap
- Final Thoughts
TL;DR
- Data science is an interdisciplinary field combining statistics, computer science, and domain expertise
- Key components include data collection, preprocessing, exploratory data analysis, and machine learning
- Advanced techniques like NLP, computer vision, and time series analysis are reshaping industries
- Python and R are the go-to languages, with cloud platforms offering scalable solutions
- Ethical considerations and responsible AI practices are crucial in modern data science
- The field is rapidly evolving, with new job opportunities and technologies emerging constantly
Decoding the Data Science DNA: An Introduction
Data science isn't just a buzzword—it's the backbone of modern decision-making. It's where number-crunching meets storytelling, and algorithms dance with insights. We're talking about a field that's as diverse as it is deep, pulling together threads from statistics, computer science, and problem-solving. It's come a long way since its early days of basic statistical analysis. Now, we're in the era of AI and big data, where data scientists are turning raw information into gold.
Unpacking the Data Science Toolbox
What's in a data scientist's toolkit? It's a mix of hard skills and soft skills that'd make any Swiss Army knife jealous. On the technical side, we're talking programming languages (Python and R are the cool kids on the block), statistical analysis (because numbers don't lie, but they do need interpreting), and machine learning (teaching computers to think—what could go wrong?). But don't forget the soft skills—communication is key because explaining complex models to non-technical folks is an art form in itself. And domain expertise—knowing the business you're working in can be the difference between a good data scientist and a great one.
The Historical Tapestry of Data Science
Data science has roots that go way back. We're talking pre-computer era, when statisticians were doing their thing with pen and paper. Then came the computer revolution, and suddenly, we could crunch numbers faster than you can say "regression analysis." Fast forward to today, and we've got machine learning algorithms that can predict your next online purchase before you even know you want it. It's been quite the journey, and we're not done yet—not by a long shot.
Riding the Wave of Current Trends
AI that can chat like a human, algorithms that can spot a cat in a picture faster than you can say "meow," and data processing that happens so fast it'd make your head spin. Edge computing is bringing data analysis closer to the source, and federated learning is keeping data private while still being useful. These insights are worth their weight in gold (and then some).
Discover everything you need to know about gpt wrappers
According to the U.S. Bureau of Labor Statistics, employment of data scientists is projected to grow 35 percent from 2022 to 2032, much faster than the average for all occupations. ["U.S. Bureau of Labor Statistics"]
The Building Blocks: Core Components of Data Science
Data science isn't just one thing—it's a whole buffet of techniques and processes. First up, we've got data collection and preprocessing. This is where we gather all the juicy data and clean it up. Then we've got exploratory data analysis, or EDA as the cool kids call it. This is where we put on our detective hats and start looking for patterns. And of course, we can't forget about machine learning—the secret sauce that makes predictions and finds hidden insights.
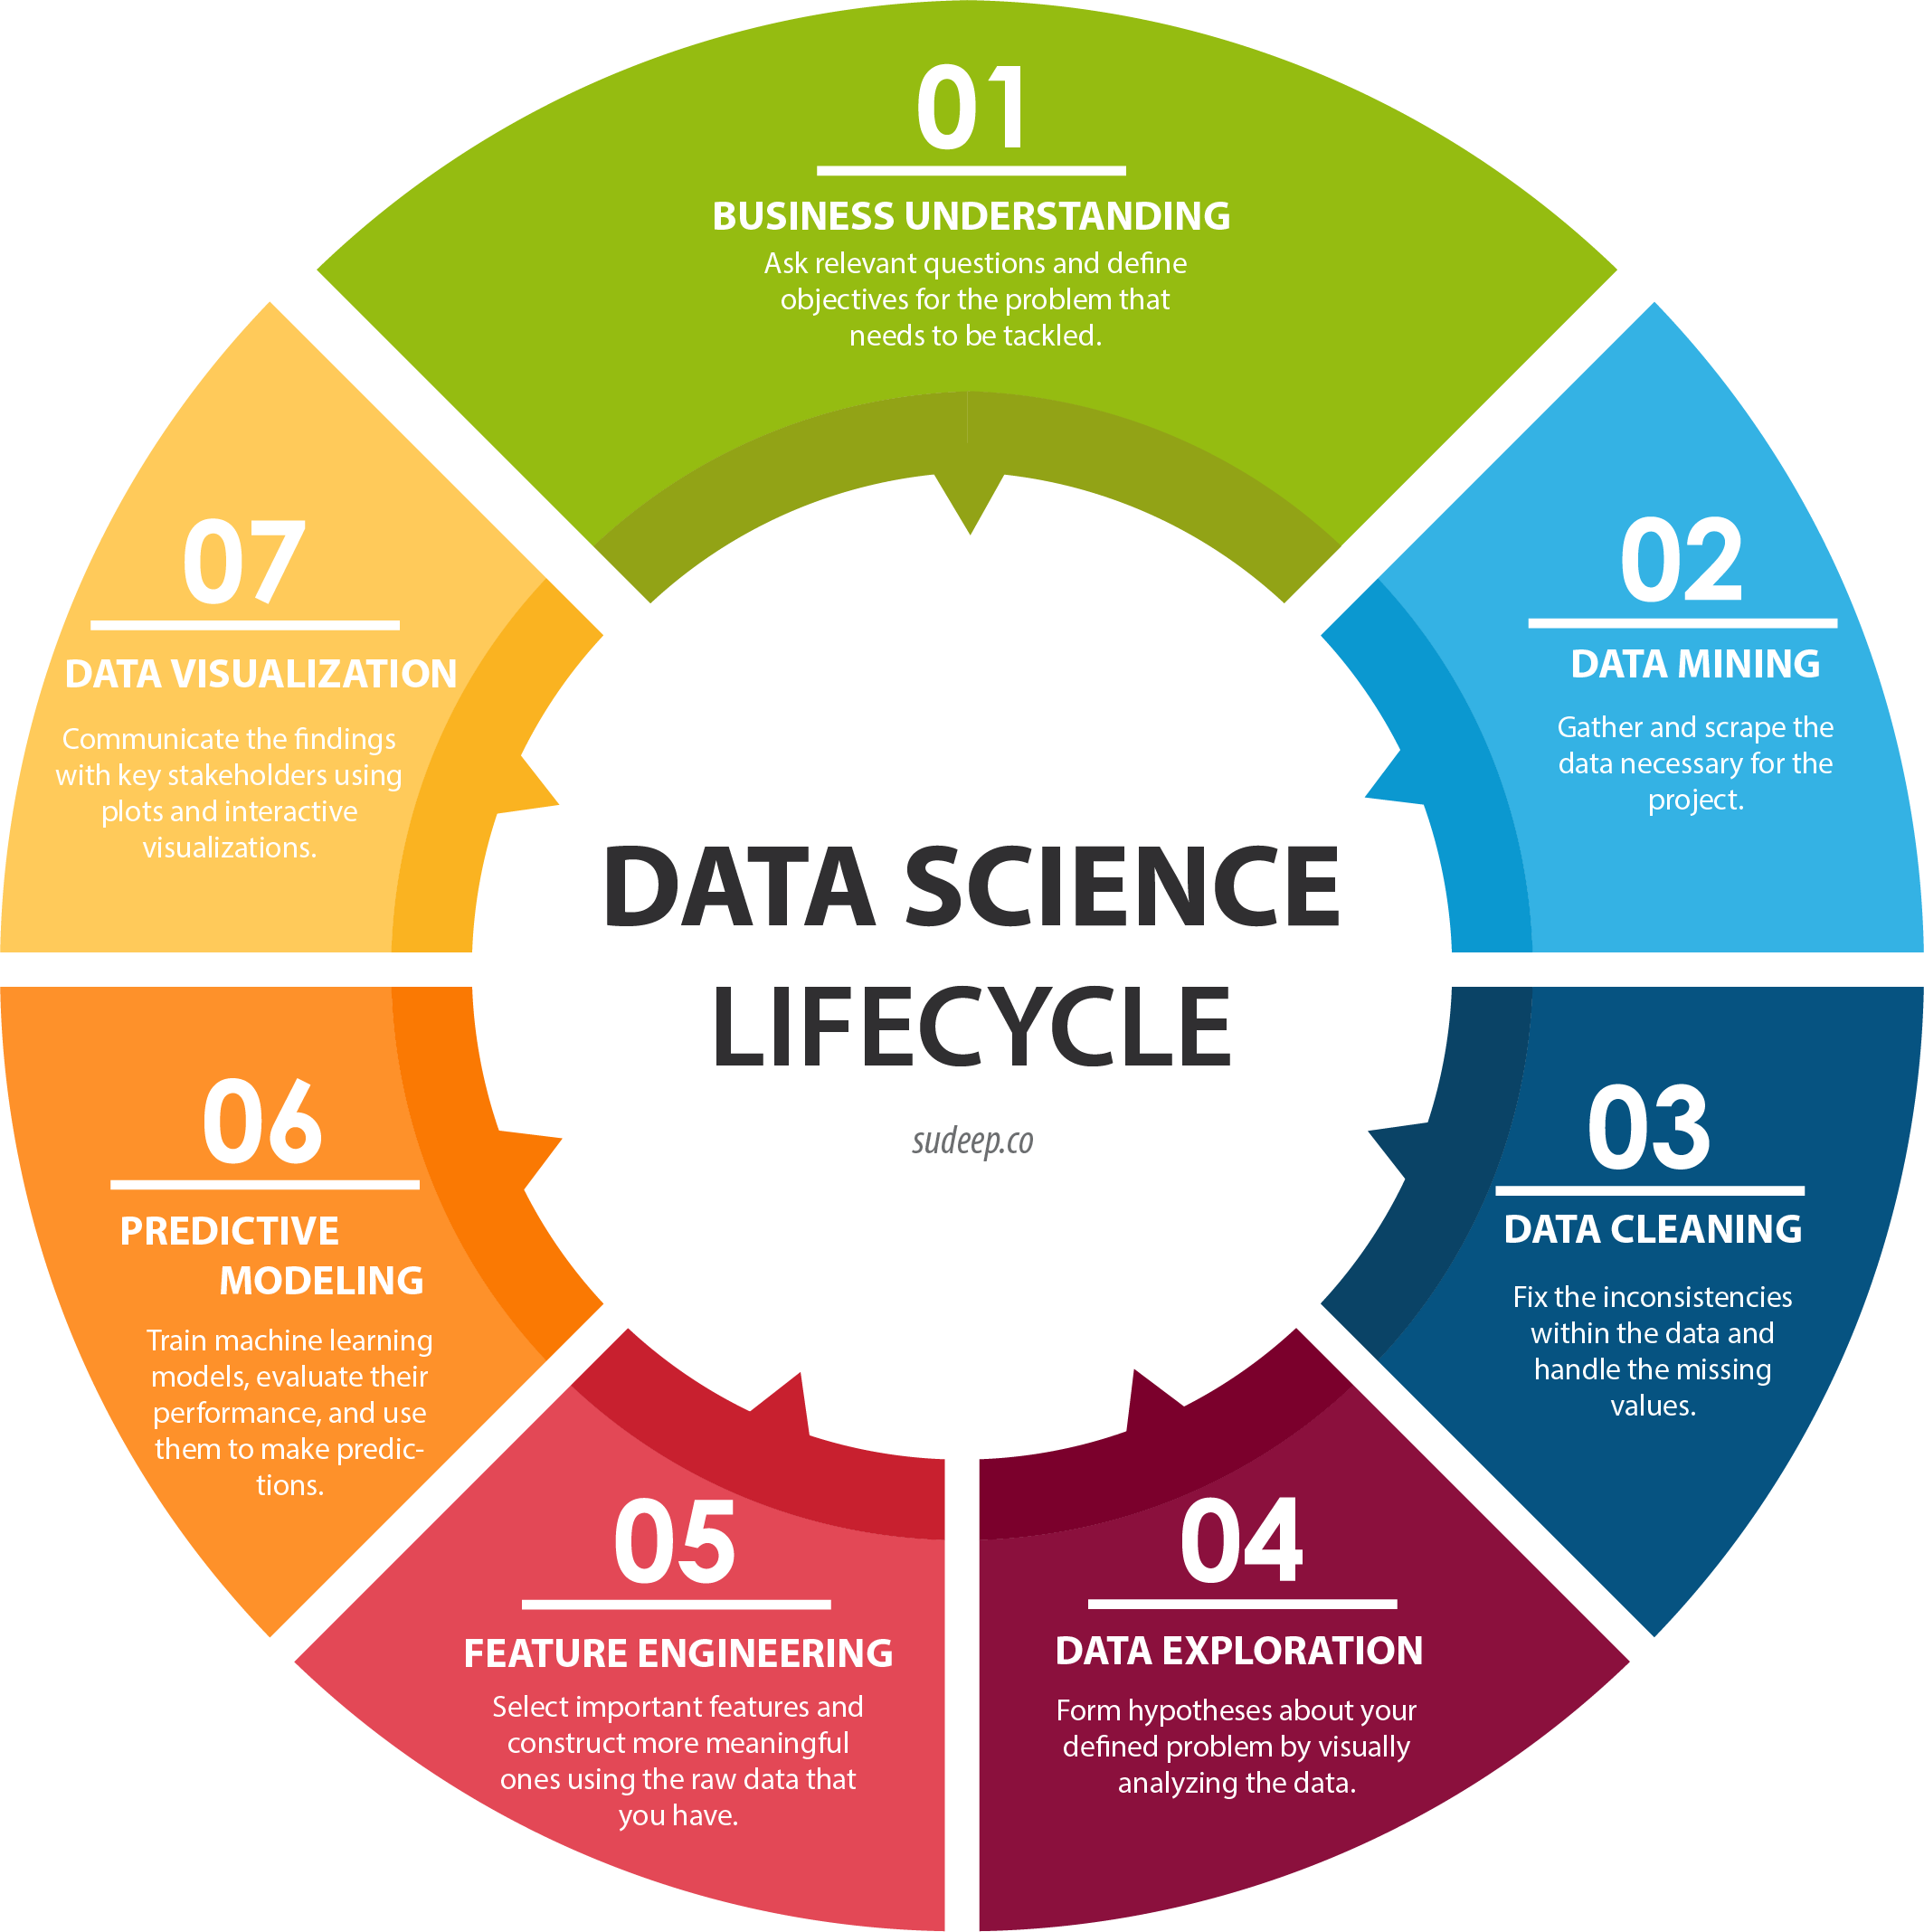
The Art of Data Wrangling: Collection and Preprocessing
Data collection is like fishing—you never know what you're gonna catch. That's where preprocessing comes in. We're talking cleaning up missing values, dealing with outliers, and making sure everything's in the right format. It's not glamorous, but it's essential. After all, you wouldn't build a house on a shaky foundation, would you?
Navigating the Data Seas: Sources and Types
Data comes in all shapes and sizes. You've got your structured data, all neat and tidy in rows and columns—think spreadsheets and databases. Then there's unstructured data, the wild child of the data world. This includes things like text from social media, images, and even audio files. And semi-structured data, the middle child that can't decide what it wants to be when it grows up. Each type has its own quirks and challenges, and part of being a good data scientist is knowing how to handle them all.
The Data Cleanup Crew: Techniques and Tools
Time to roll up our sleeves and get our hands dirty with some data cleaning. First things first, we've gotta deal with those pesky missing values. Do we ignore them? Fill them in? Then there's the joy of handling outliers—those data points that are so far out there, they're practically in another galaxy. And don't even get me started on inconsistent formatting. Is it "USA," "U.S.A.," or "United States"? Luckily, we've got tools like Python's Pandas library that make this process less painful.
Exploratory Data Analysis: Your Data's Story
Exploratory Data Analysis, or EDA, is where things start to get interesting. This is where we put on our Sherlock Holmes hat and start investigating our data. We're looking for patterns, relationships, and anything that seems a bit... off. We use a mix of statistical measures and visualizations to really get to know our data. And data can be full of surprises. I once found a correlation between ice cream sales and sunburn incidents—turns out people buy more ice cream when it's sunny. Who knew?

The Numbers Game: Statistical Measures
Statistical measures are the bread and butter of EDA. We're talking mean, median, mode—the three musketeers of central tendency. Then we've got standard deviation and variance, telling us how spread out our data is. These measures give us a quick snapshot of what's going on with our data. But here's the catch—they can also be misleading if we're not careful.
Picture Perfect: Data Visualization Tools
They say a picture is worth a thousand words, and in data science, a good visualization is worth a thousand spreadsheets. We've got a whole arsenal of tools to make our data look pretty (and informative). There's Matplotlib for the Python folks—it's like the Swiss Army knife of plotting libraries. Then we've got Seaborn, which is Matplotlib's cooler, more stylish cousin. And for those who want to create interactive dashboards that'll make executives drool, there's Tableau. These tools turn boring numbers into beautiful charts, graphs, and plots.
Machine Learning: Teaching Computers to Fish
Machine learning is all about creating algorithms that can learn from and make predictions or decisions based on data. We've got supervised learning, where we give the algorithm labeled examples to learn from, and unsupervised learning, where we let the algorithm figure things out on its own. And then there's deep learning, which is like machine learning on steroids. It's powerful stuff, but with great power comes great responsibility (and occasionally, great confusion).
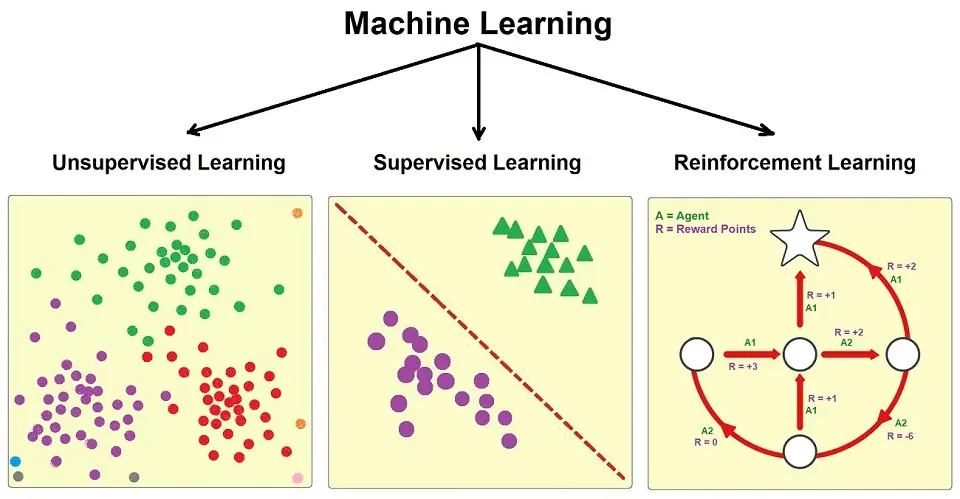
Supervised Learning: The Art of Prediction
Supervised learning is great for things like spam detection (is this email about a Nigerian prince legit?), image classification (is this a picture of a hot dog or not?), and predicting house prices (spoiler: it's always more than you think). The key here is having good, labeled training data. Without that, your model is about as useful as a chocolate teapot.
Unsupervised Learning: Finding Hidden Patterns
Unsupervised learning is great for finding hidden patterns or grouping similar things together. Ever wonder how Netflix recommends shows you might like? That's unsupervised learning in action. It's also useful for anomaly detection—like spotting that one weird transaction in your bank statement. The beauty of unsupervised learning is that it can uncover insights you never even thought to look for.
Deep Learning and Neural Networks: The Brain Imitators
Deep learning is where things get, well, deep. We're talking about neural networks that are inspired by the human brain—except these artificial brains don't need coffee to function. These networks can have many layers (hence the "deep" part) and can tackle super complex tasks like recognizing speech, translating languages, or even generating art. But here's the catch—training these models can take forever and eat up more computing power than a teenage gamer's setup. Plus, they're often black boxes, meaning we can't always explain why they make certain decisions.
Pushing the Envelope: Advanced Data Science Techniques
We're about to venture into the cutting edge of data science. Natural Language Processing? It's making computers understand human gibberish. Computer Vision? Teaching machines to see better than your average teenager glued to their phone. And Time Series Analysis? It's giving your data a crystal ball. These advanced techniques are turning sci-fi dreams into reality, one algorithm at a time.

Natural Language Processing: Teaching Machines to Speak Human
Natural Language Processing, or NLP, is all about making computers understand and generate human language. NLP is behind things like chatbots, machine translation, and those ads that seem to know exactly what you were talking about yesterday. It's a field that's advancing faster than you can say "Hey Siri," with models like GPT-3 writing essays that'd make your English teacher proud (or terrified). But it's not all smooth sailing—languages are messy, context is tricky, and sarcasm? Forget about it. Still, NLP is changing the game in how we interact with technology.
Text Classification: Sorting Through the Chatter
Text classification is all about taking chunks of text and sorting them into predefined categories. This could be anything from sorting emails into "spam" or "not spam", to categorizing news articles, or even determining the sentiment of tweets. It's super useful for things like content moderation, customer feedback analysis, and figuring out if that movie review is actually saying the film is good or if it's just being sarcastic. The tricky part? Words can have multiple meanings, and context is everything.
Sentiment Analysis: The Digital Mood Ring
Sentiment analysis aims to determine the emotional tone behind words, helping businesses understand how people feel about their products, services, or brand. It's widely used in social media monitoring, market research, and customer service. Imagine being able to sift through millions of tweets and instantly know if people love or hate your new product launch. But here's the kicker—sarcasm and cultural nuances can throw a major wrench in the works. A phrase like "Yeah, right" could mean agreement or total disbelief, depending on the context.
Computer Vision: Teaching Machines to See
Computer vision is all about teaching computers to understand and process visual information from the world around us. This field is behind some pretty cool tech—facial recognition that unlocks your phone, self-driving cars that can detect pedestrians, and medical imaging systems that can spot tumors better than some doctors. But it's not all smooth sailing. Variations in lighting, occlusions, and the sheer complexity of the visual world make this a tough nut to crack.
Image Classification: What's in This Picture?
Image classification is all about teaching computers to look at an image and say, "Yep, that's a cat" or "Nope, that's not a hotdog." This technology is used in everything from photo organization apps to medical diagnosis. But it's not always easy. Sometimes the computer might confuse a chihuahua for a blueberry muffin (it's happened, look it up). The key is having a diverse training dataset—you can't expect the model to recognize a platypus if it's never seen one before.
Object Detection: Finding Waldo, But Everywhere
Object detection doesn't just classify what's in an image—it can find and locate specific objects within a scene. It's the technology behind those cool bounding boxes you see in self-driving car simulations, or in security systems that can spot a suspicious package. But it's not all fun and games. Detecting small objects, dealing with occlusions (when objects are partially hidden), and processing images in real-time can be real head-scratchers.
Time Series Analysis: Predicting the Future (Sort Of)
Time series analysis is all about analyzing data points collected over time to extract meaningful statistics and characteristics. This technique is crucial for forecasting future values based on historical data. Think stock market predictions, weather forecasts, or figuring out when your favorite coffee shop is likely to be busy. But here's the catch—time series data can be tricky. Seasonal patterns, trends, and unexpected events can throw your predictions for a loop.

Forecasting: Crystal Ball Not Required
Forecasting is where time series analysis really shines. This technique is used to predict future values based on historical time series data. It's how weather forecasts are made, how businesses predict future sales, and how economists make those economic forecasts that may or may not come true. But here's the thing—forecasting isn't always accurate. Unexpected events, changes in trends, or just the general chaos of the world can throw predictions off.
Anomaly Detection: Spotting the Odd One Out
Anomaly detection in time series is used to identify unusual patterns that don't conform to expected behavior. It's super useful for things like fraud detection in banking, monitoring industrial equipment for faults, or spotting weird blips in website traffic analysis. The tricky part is defining what's "normal" and what's not. Sometimes an anomaly is obvious, like a sudden spike in temperature readings. Other times, it's more subtle, like a gradual drift in sensor measurements.
The Data Scientist's Arsenal: Tools and Technologies
We've got programming languages that can crunch numbers faster than you can say "statistical significance," big data technologies that can handle more information than the Library of Congress, and cloud platforms that give us enough computing power to make NASA jealous.
Programming Languages: Speaking Data Science
Python and R are the dynamic duo of data science languages. Python is like the Swiss Army knife of programming—it can do pretty much anything, from data analysis to web development. R, on the other hand, is the statistics guru, perfect for when you need to get your math on. But SQL, the language of databases, keeps the show running.
Python Libraries: The Data Scientist's Toolkit
NumPy gives you lightning-fast array operations. Pandas lets you wrangle data like a pro rodeo cowboy. Scikit-learn is your go-to for machine learning - it's like having a robot assistant who's really good at math. And TensorFlow and PyTorch for deep learning - they're the heavyweight champions of neural networks. These libraries save us from reinventing the wheel every time we start a new project.
R Packages: Statistical Paradise
The tidyverse is the star of the show, making data manipulation and visualization as smooth as butter. ggplot2 turns your data into eye candy. For machine learning, caret is your trusty sidekick, ready to train and evaluate models faster than you can say "cross-validation." And if you're into time series analysis, forecast is your crystal ball.
Big Data Technologies: Taming the Data Beast
The Hadoop ecosystem is like a data zoo, with different tools for different jobs. HDFS is for distributed storage. MapReduce is the old workhorse for processing, but it's a bit slow. That's where Apache Spark comes in, zooming through data processing like a cheetah on Red Bull. These tools let us work with data at a scale that would've been sci-fi just a few years ago.
Hadoop Ecosystem: The Data Jungle
HDFS (Hadoop Distributed File System) can store massive amounts of data across multiple machines. MapReduce is for distributed processing. Hive lets you query your data using SQL-like language, which is great for folks who break out in hives at the thought of Java. And Pig is for people who think SQL is too fancy and want to write data transformations in a script that looks like a pig wrote it.
Apache Spark: The Speed Demon
Apache Spark is designed for fast, in-memory processing, which means it can handle iterative algorithms and interactive data analysis without breaking a sweat. Spark comes with a Swiss Army knife of tools - Spark SQL for structured data, Spark Streaming for real-time processing, MLlib for machine learning, and GraphX for graph processing. You can write Spark jobs in Python, Scala, or Java, so you don't have to learn a whole new language just to go fast.
Cloud Platforms: Data Science in the Sky
These platforms give us access to mind-boggling amounts of computing power and storage. Amazon Web Services (AWS) has got everything, and they're everywhere. Google Cloud Platform (GCP) has cutting-edge AI tools that make you feel like you're in a sci-fi movie. And Microsoft Azure does a bit of everything, and it plays nice with your Windows laptop. These platforms let us scale our data science projects from "my laptop is on fire" to "I can analyze the entire internet" with just a few clicks.
AWS Data Science Services: Amazon's Data Buffet
For storage, you've got S3, which is like a bottomless pit for your data. EC2 instances are your virtual machines on steroids. For machine learning, SageMaker helps you prep, cook, and serve up machine learning models without burning the kitchen down. And if you're into big data, EMR (Elastic MapReduce) lets you spin up Hadoop clusters faster than you can say "distributed computing."
Google Cloud AI Platform: The Playground for AI Enthusiasts
Want to build a chatbot? There's Dialogflow for that. Need to add some computer vision magic to your app? Vision AI has got you covered. AutoML lets you create custom machine learning models with just a few clicks. And if you're into TensorFlow, you'll feel right at home. Plus, with Google's TPUs (Tensor Processing Units), you can crunch through neural networks like a hot knife through butter.
The Ethical Compass: Data Science Ethics and Responsible AI
Data science ethics and responsible AI are crucial for a healthy ecosystem. We need to think about privacy - because not everyone wants their data paraded around like it's in a beauty pageant. We need to consider fairness - because algorithms can be biased, even if we don't mean them to be. And we need to strive for transparency - because if we can't explain how our AI made a decision, we're basically saying "trust me, bro" to the world.
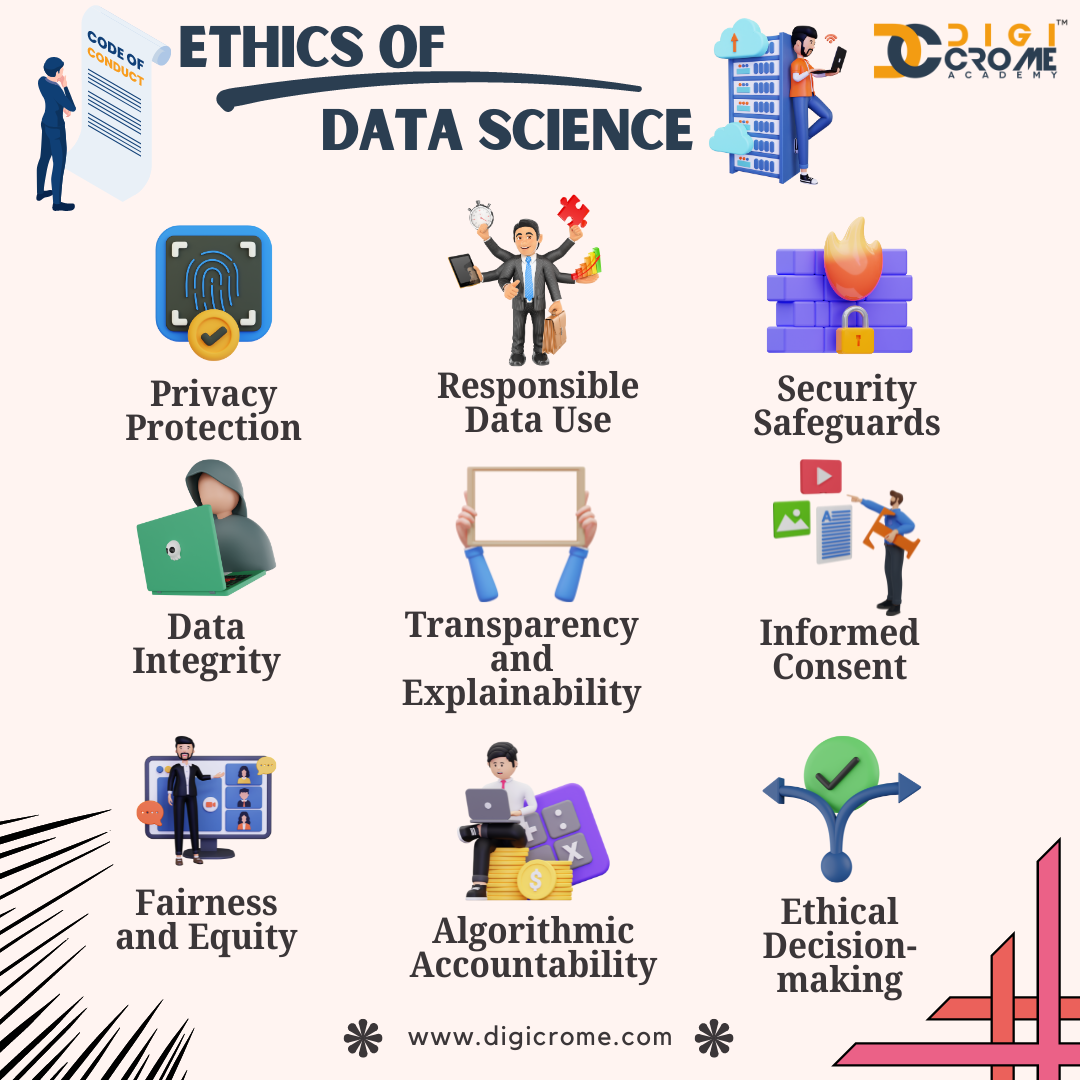
Privacy and Data Protection: Keeping Secrets in the Digital Age
GDPR (General Data Protection Regulation) swooped in like a superhero, laying down the law on how we handle personal data in Europe. But GDPR isn't the only sheriff in town. We've got CCPA in California, LGPD in Brazil, and more popping up faster than you can say "data breach." Anonymization techniques are our friends here - they're like witness protection for data. Just true anonymization is harder than it looks. You can't just slap a fake mustache on your dataset and call it a day!
GDPR and Data Regulations: The Rule Book of the Digital World
GDPR introduced concepts like the right to be forgotten (for when you want to erase your digital footprint and become a hermit) and data portability (because your data should be as mobile as you are). But GDPR isn't alone in the regulation party. CCPA crashed the party in California, bringing its own flavor of data protection. And LGPD is doing its thing in Brazil, proving that data protection isn't just a European hobby.
Anonymization Techniques: The Witness Protection Program for Data
We've got methods like data masking, where we replace sensitive info with realistic-looking fake data. Then there's tokenization, which swaps out sensitive data for tokens. And don't forget about differential privacy, the mathematical ninja of privacy protection. It adds just enough noise to your data to protect individuals while still keeping the overall patterns intact.
Bias and Fairness in AI: Teaching Machines to Play Nice
Bias can creep in from our training data, our feature selection, or even from our own unconscious biases. The goal is to create AI systems that are fair and equitable, treating everyone equally regardless of their race, gender, or whether they prefer Star Wars or Star Trek.
Bias Detection: Sniffing Out the Bad Apples
We can use statistical measures to check if our model is favoring certain groups over others. Visualization techniques can help us spot patterns that might indicate bias. And diverse testing data is crucial. If we only test our facial recognition software on pictures of middle-aged white guys, we shouldn't be surprised when it can't recognize anyone else.
Fairness-aware Machine Learning: Teaching AI to Play Fair
Some techniques involve preprocessing our data to remove biases before training. Other methods focus on in-processing, constraining our models during training to ensure fairness. And then there's post-processing, where we adjust our model's outputs to be more fair. The tricky part is that there are multiple definitions of fairness, and sometimes they conflict with each other.
Explainable AI (XAI): Lifting the Black Box Curtain
Explainable AI (XAI) is our attempt to peek inside the black box and understand what's going on. Why? Because in many cases, especially in fields like healthcare or finance, we need to know not just what the prediction is, but why it was made. XAI techniques help us interpret our models, understand their decision-making process, and explain their predictions in human-understandable terms.
Model Interpretability Techniques: Decoding the AI's Mind
LIME (Local Interpretable Model-agnostic Explanations) explains individual predictions by approximating the model locally. Shapley values, borrowed from game theory, help us understand how each feature contributes to a prediction. For tree-based models, we can extract feature importances to see which variables are doing the heavy lifting. And visualization techniques can sometimes explain things better than words.
SHAP Values: The Fairness Calculator
SHAP (SHapley Additive exPlanations) values are based on Shapley values from game theory, which is a fancy way of saying they're really good at fairly distributing credit (or blame) among a group. SHAP values tell us how much each feature contributed to a particular prediction, taking into account all possible combinations of features. They're consistent and locally accurate, which is data science speak for "they make sense and they're trustworthy."
Wrapping It Up: Key Learnings and Future Horizons
We've covered a lot of ground, from wrangling data like a digital cowboy to teaching AI to play nice. In this field, the only constant is change - well, that and the occasional inexplicable error in your code that disappears when you restart your computer.
Key Takeaways: The Data Science Cheat Sheet
- Data science is like a Swiss Army knife for the digital age - it's got tools for everything from crunching numbers to predicting the future.
- Python and R are the dynamic duo of data science languages.
- Machine learning is teaching computers to learn from data.
- Big data technologies let us work with data so massive it would make your laptop cry. Hadoop and Spark are your friends here.
- Cloud platforms give us superpowers. AWS, Google Cloud, and Azure are like the Avengers of the cloud world.
- Ethics in AI isn't just a buzzword - it's crucial.
- Explainable AI is about making our models less like magic black boxes and more like open books.
The Road Ahead: Future Trends in Data Science
- AutoML will continue to rise, making machine learning more accessible.
- Edge AI is going to be huge. We're talking AI on your devices, making decisions faster than you can say "low latency."
- Quantum computing might just turn the data science world upside down.
- Ethical AI and fairness will (hopefully) move from buzzwords to standard practice.
- The Internet of Things (IoT) will generate more data than we know what to do with.
- Augmented analytics will make data insights more accessible to non-techies.
According to Simplilearn, there are expected to be 11.5 million new jobs for data science by 2026. ["Simplilearn"]
Purdue University has launched a new 100% online Master of Science in data science degree to address the high demand for trained data scientists. The program is designed for working professionals from both technical and non-technical backgrounds. ["Purdue University"]
Final Thoughts: Your Data Science Journey Starts Now
We've traversed the peaks of machine learning, waded through the rivers of big data, and navigated the sometimes murky waters of AI ethics. But this is just the beginning of your journey. The world of data science is vast and ever-changing.
As we've seen, the demand for data science skills is skyrocketing. With 11.5 million new jobs expected by 2026, there's never been a better time to dive into this field. Universities are catching on too - just look at Purdue's new online Master's in Data Science.
The field of data science moves faster than a caffeinated ch eetah, so staying updated is crucial. Read blogs, attend conferences, experiment with new tools, and for some reason, please back up your code.
Being a good data scientist isn't just about crunching numbers and building models. It's about curiosity, creativity, and a dash of skepticism. It's about asking the right questions and sometimes questioning the answers. And most importantly, it's about using your powers for good. We have the ability to shape the future with data - let's make it a future we want to live in.
Recent developments in RAG (Retrieval-Augmented Generation) techniques highlight the importance of effective chunking strategies in AI applications. Semantic splitting is emerging as a preferred method for capturing themes more accurately in text processing. ["Towards Data Science"]
How AnotherWrapper Can Boost Your Data Science Journey
AnotherWrapper is an all-in-one Next.js AI starter kit that can turbocharge your data science and AI projects. It comes packed with pre-built integrations and demo applications that cover many of the advanced topics we've discussed. Natural Language Processing? Check. Computer vision? You bet. Machine learning model deployment? It's got you covered.
For all you data scientists and AI developers out there looking to quickly prototype and launch applications, AnotherWrapper's boilerplate code and ready-to-use demos can save you a ton of time.
AnotherWrapper's structured approach can help ensure that best practices in data handling, user privacy, and model explainability are baked in from the get-go.
Whether you're building a text generation tool that writes poetry, an image analysis application that can tell a hot dog from a not hot dog, or a speech-to-text service that finally understands your grandma's accent, AnotherWrapper has got your back.
Discover how to build a SaaS from scratch with our comprehensive guide